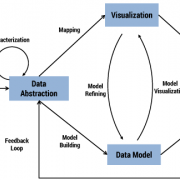
In recent years, visual analytics (VA) has been introduced to represent massive multidimensional temporal data with various visual encodings. VA combines automated analysis techniques with interactive visualizations to enable effective understanding, reasoning, and decision making on the basis of very large and complex data sets.
Article
Picture This: Using 3D Visual Analytics to Explore Complex Temporal Data
Posted May 19, 2017 | Leadership | Technology | Amplify

Don’t have a login?
Make one! It’s free and gives you access to all Cutter research.

